
Dashboard
Where: Admin portal → Dashboard (the first entry in the menu)
Route: /dashboard
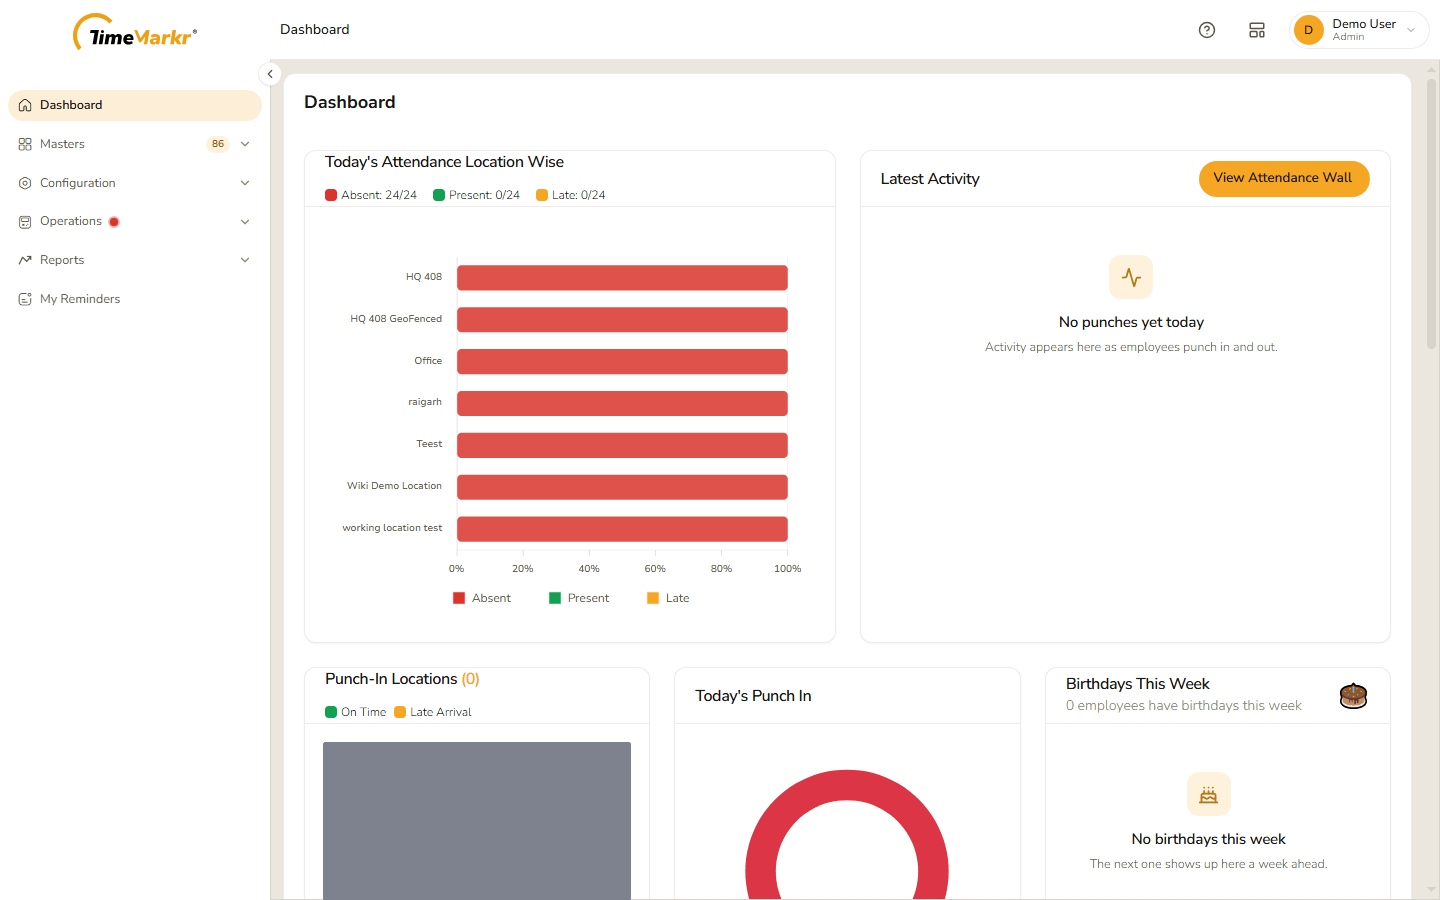
The first page after you sign in: today's attendance at a glance and how the last thirty days have gone. Nothing needs to be chosen – everything is drawn from the data of your company as soon as the page opens.
Until your company profile is filled in and a shift, a working location, a department and a designation exist, a banner at the top reads Finish setting up. Its Start setup wizard button opens the Setup Wizard, which walks you through all of it.
Today
| Card | What it shows |
|---|---|
| Today's Attendance Location Wise | One bar for each working location, split into Absent (red), Present (green) and Late (amber). The line above the chart gives the totals for the company – for example Absent: 24/24 · Present: 0/24 · Late: 0/24. |
| Latest Activity | A live feed of the punches made today, newest first. With no punches it says "No punches yet today – Activity appears here as employees punch in and out." The View Attendance Wall button opens the Attendance Wall. |
| Punch-In Locations | A map with a marker for every punch-in of today – green for On Time, amber for Late Arrival – and the count in the heading. |
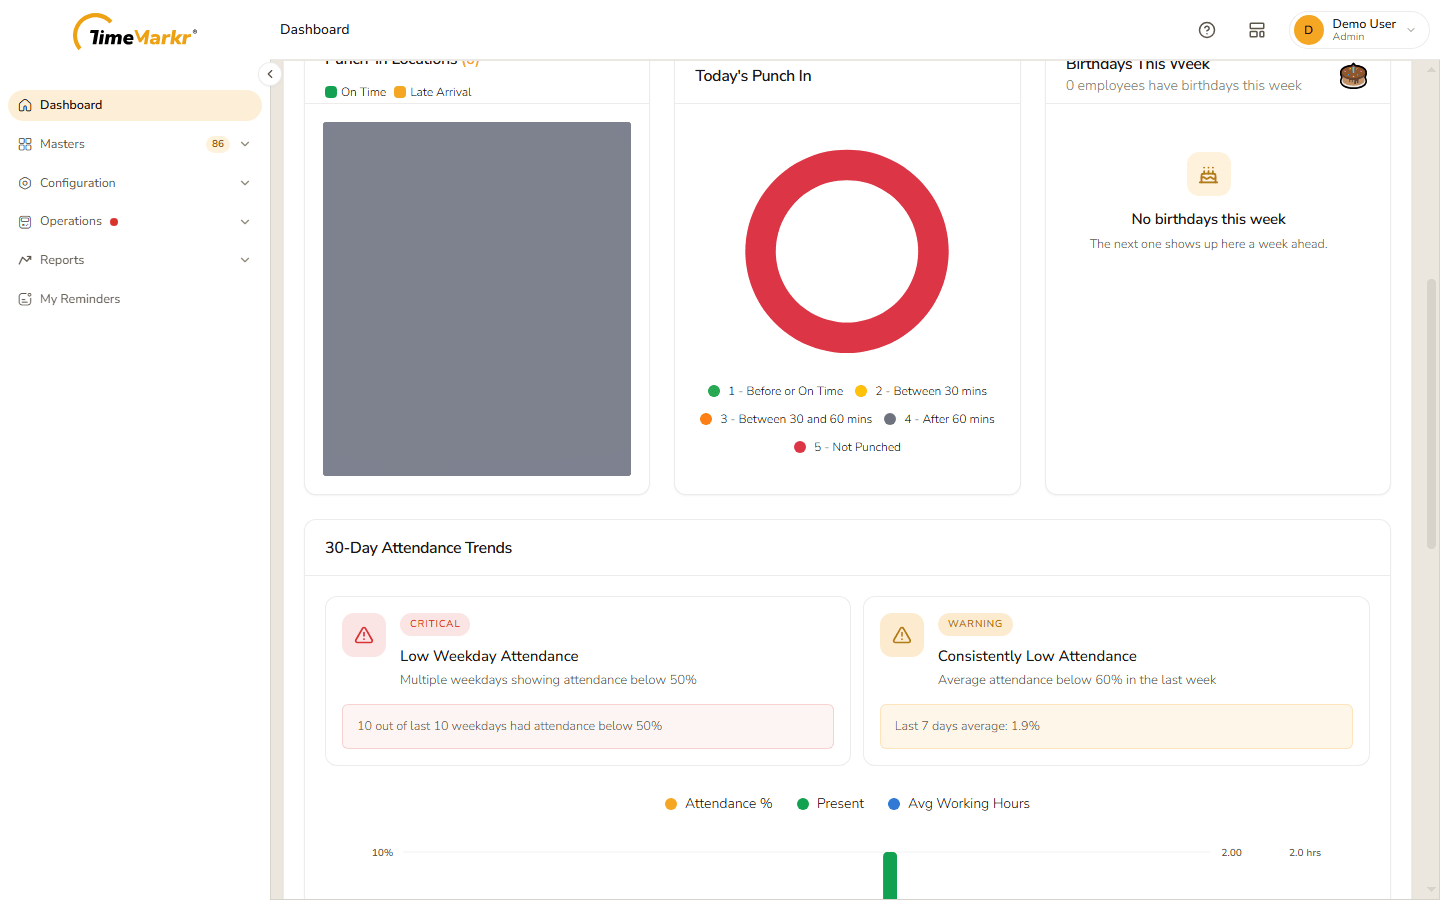
| Today's Punch In | A ring that sorts today's employees by when they punched in: 1 – Before or On Time, 2 – Between 30 mins, 3 – Between 30 and 60 mins, 4 – After 60 mins and 5 – Not Punched. |
| Birthdays This Week | The employees whose birthday falls this week, or "No birthdays this week – The next one shows up here a week ahead." |
The last thirty days
30-Day Attendance Trends opens with up to two alerts – a red Critical one such as Low Weekday Attendance – Multiple weekdays showing attendance below 50% and an amber Warning such as Consistently Low Attendance – Average attendance below 60% in the last week. Each repeats the figure behind it.
Under the alerts a chart follows the month day by day with three series – Attendance %, Present (the number of employees) and Avg Working Hours.
Four tiles below the chart sum up the same thirty days, each with a small line of its own:
| Tile | What it shows |
|---|---|
| Avg Attendance | The average attendance percentage. |
| Total Present | The number of present days. |
| Total Absent | The number of absent days. |
| Avg Working Hours | The average hours worked per day. |
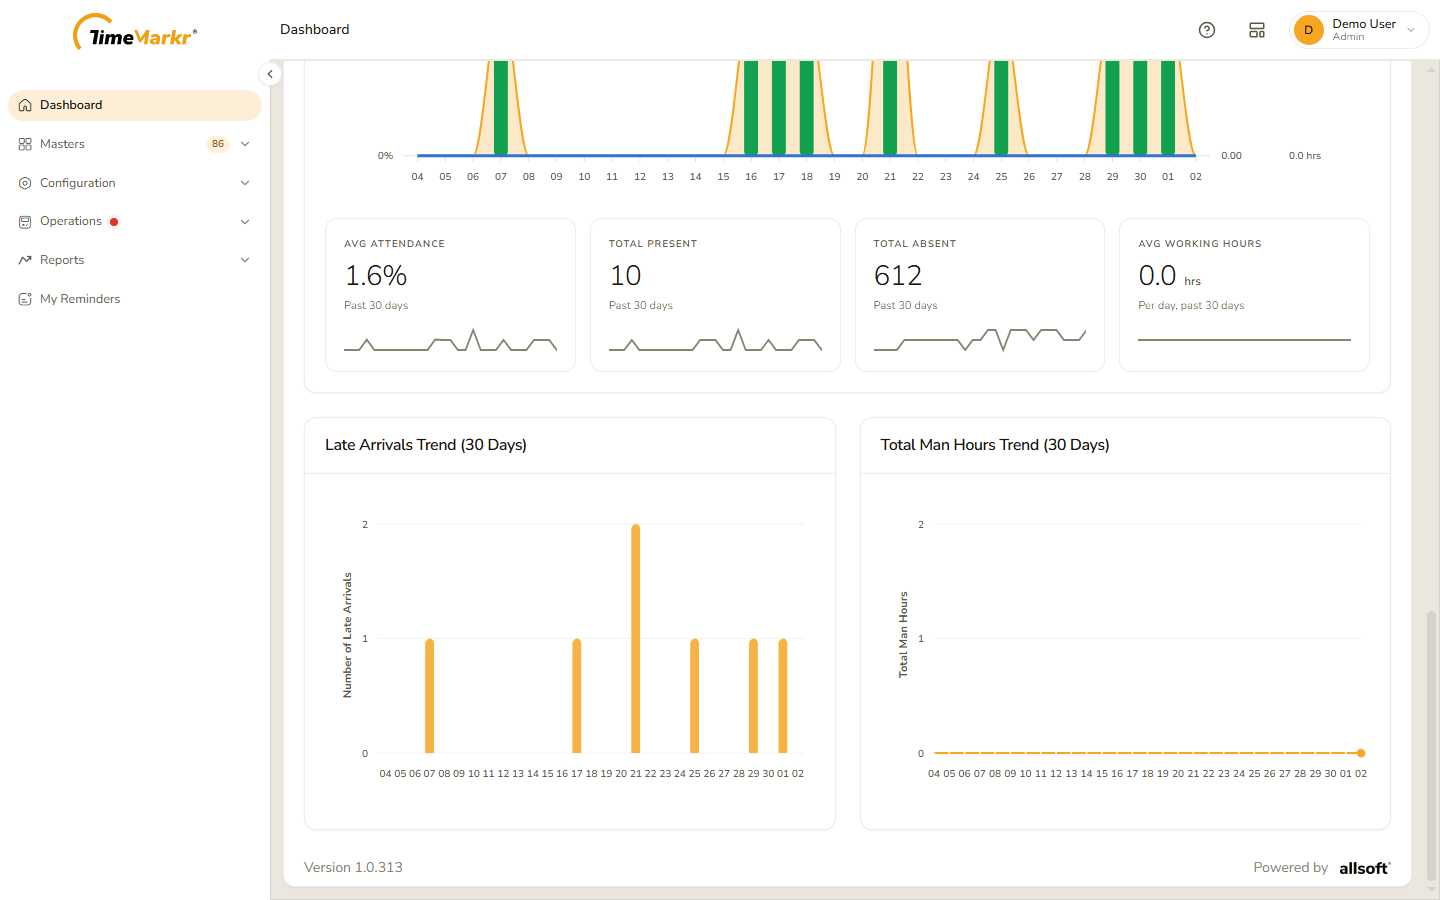
Two more charts finish the page: Late Arrivals Trend (30 Days) – the number of late arrivals on each day – and Total Man Hours Trend (30 Days) – the hours worked by everyone together on each day.
Related: Setup Wizard · Attendance Wall · Reports · Late Punch Report